The Global Monitoring Report on Non-Bank Financial Intermediation 2019 presents the results of the FSB’s annual monitoring exercise to assess global trends and risks from non-bank financial intermediation (NBFI).

The annual monitoring exercise is part of the FSB’s strategy to enhance the resilience of NBFI. The exercise compares the size and trends of financial sectors in aggregate and across jurisdictions. The FSB focuses particularly on those parts of NBFI that may pose bank-like financial stability risks and/or regulatory arbitrage.
Section 1 introduces the FSB’s monitoring approach, including the scope, data, and terminology. It also describes recent innovations in NBFI. The 2019 report covers data up to end-2018 from 29 jurisdictions, which together represent over 80% of global GDP.
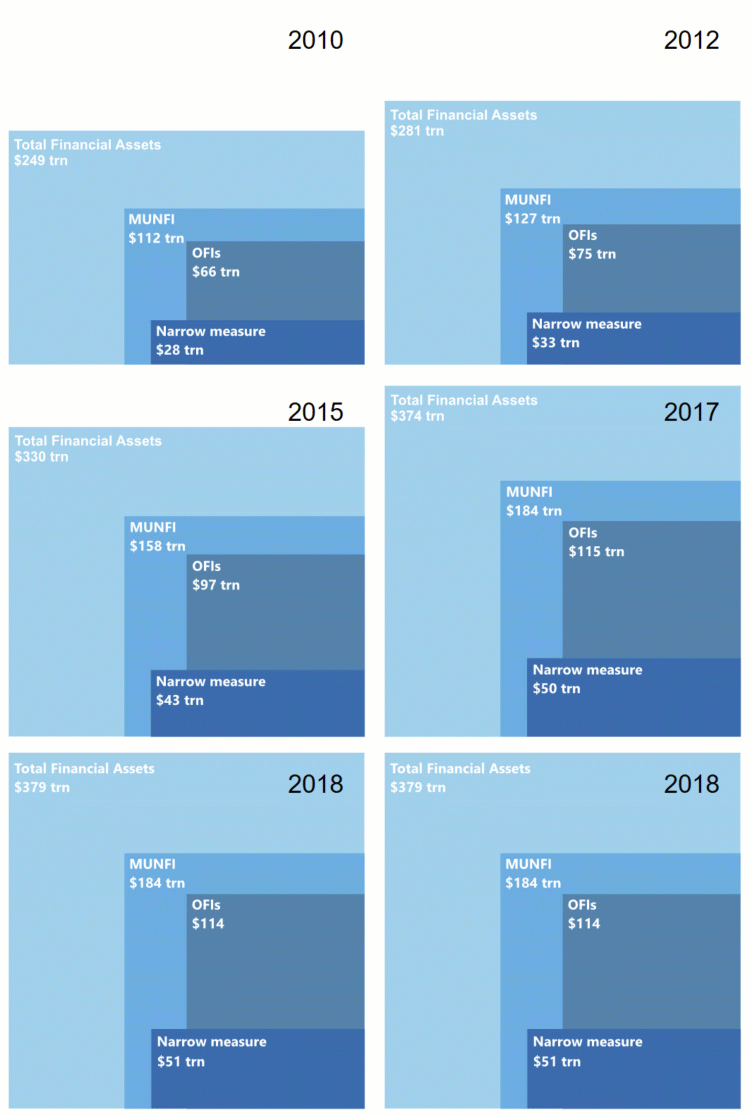
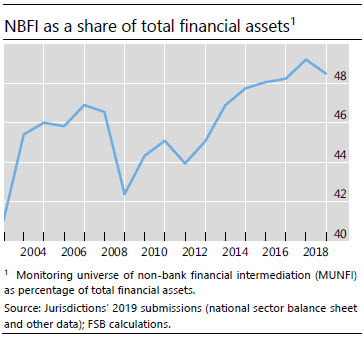
Section 2 provides an overview of the size and growth of all sectors in the financial system. Total global financial assets grew by 1.4% in 2018, driven largely by banks. Within MUNFI (Monitoring Universe of Non-Bank Financial Intermediation) assets of insurance corporations and pension funds remained largely unchanged, while those of OFIs (Other Financial Intermediaries) declined marginally as a result of stock market declines in late 2018 and, to a lesser extent, outflows from some of these entities.

In 2018, lending assets of OFIs, which comprise all financial institutions that are not central banks, banks, insurance corporations, pension funds, public financial institutions or financial auxiliaries grew by 3.0%, largely driven by the euro area. In comparison, bank loans grew by 5.9%. Repo assets and liabilities of OFIs increased in 2018, with the net repo position remaining largely unchanged. Growth in repo assets of banks exceeded that of repo liabilities.
Section 3 assesses the interconnectedness among financial entities, both within and across borders. Interconnectedness between banks and OFIs through credit and funding relationships has remained largely unchanged since 2016, after declining from its 2009 levels. Investment funds and money market funds remain the largest OFI sub-sectors that provide credit to banks.
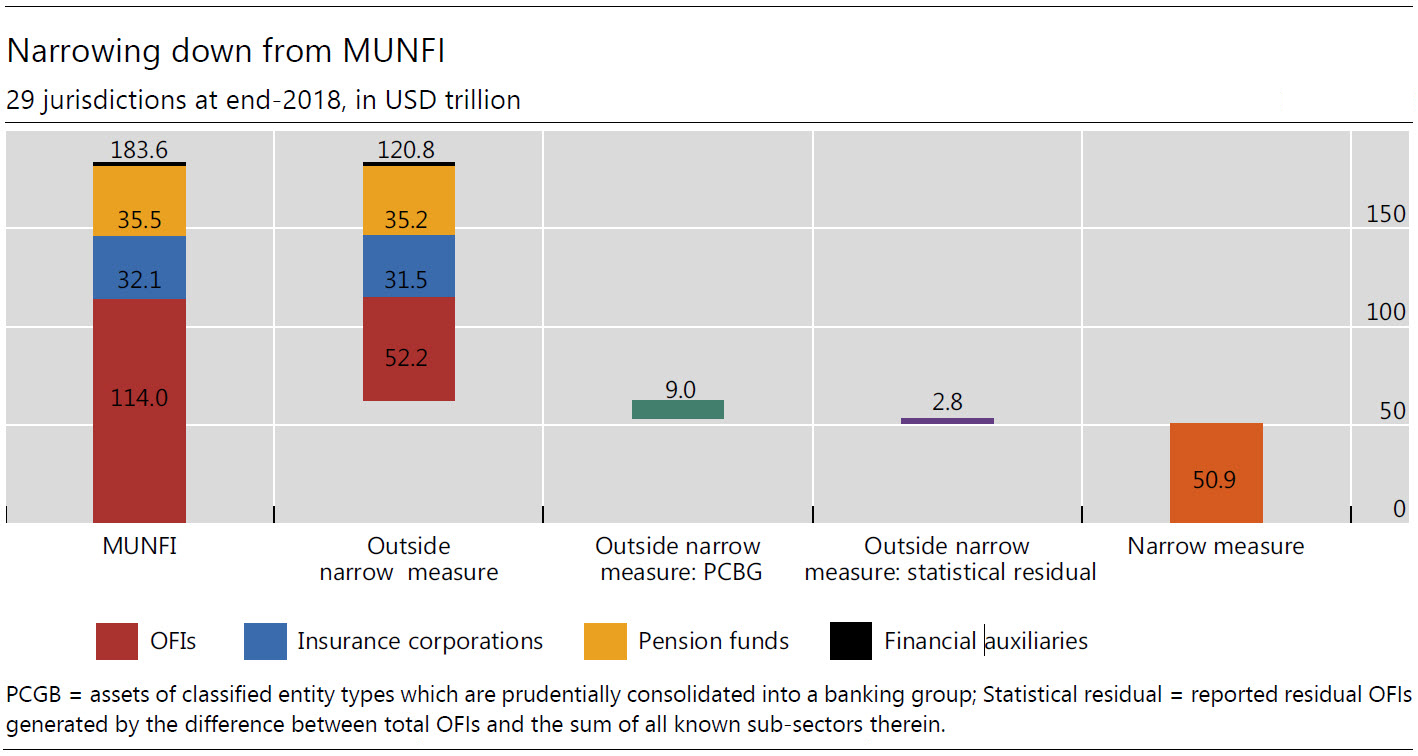
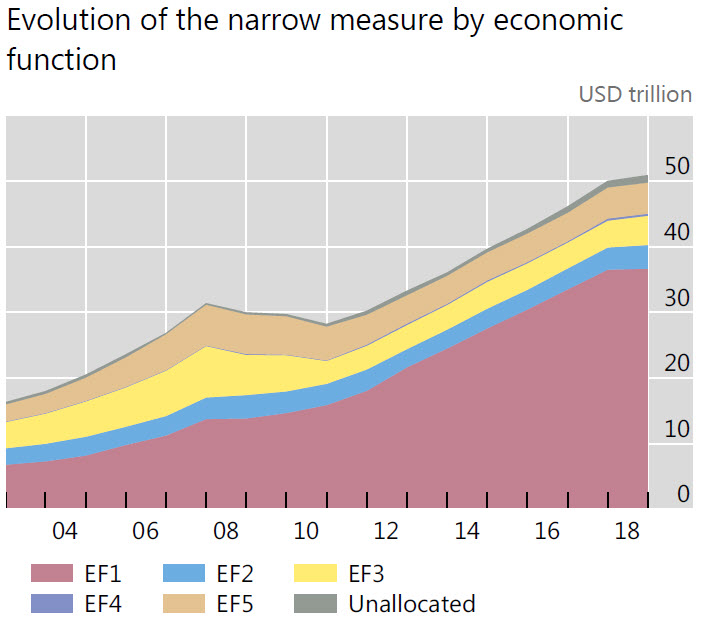
Section 4 focuses on those parts of NBFI where bank-like financial stability risks may arise. This narrow measure of NBFI grew by 1.7%, to $50.9 trillion in 2018, compared to an average annual growth rate of 8.5% from 2012 to17. It now represents 13.6% of total global financial assets. The narrow measure, which reflects an activity-based “economic function” (EF) assessment of risks, includes the following elements:

The narrow measure, which reflects an activity-based “economic function” (EF) assessment of risks, includes the following elements:
- Collective investment vehicles (CIVs) with features that make them susceptible to runs (EF1) grew by 0.4% in 2018, much less than the 11.0% average annual growth rate from 2012 to 2017. CIVs represent 72.0% of the narrow measure. Two of the largest EF1 entity types, money market funds and fixed income funds, invest primarily in credit assets and engage in liquidity and maturity transformation.
- Non-bank financial entities engaging in loan provision that is dependent on short-term funding (EF2) grew by 6.9% in 2018, representing 7.0% of the narrow measure. Finance companies, the entity type most commonly classified into EF2, displayed a somewhat elevated degree of leverage, but have moderate maturity transformation in most jurisdictions.
- Market intermediaries that depend on short-term funding or secured funding of client assets (EF3) grew by 8.7% in 2018, representing 8.8% of the narrow measure. Broker-dealers that are not prudentially consolidated into banking groups constitute the largest EF3 entity type; they employ significant leverage, particularly when accounting for off-balance sheet exposures. Broker-dealer leverage increased modestly in 2018 in most jurisdictions. In aggregate, it remains lower than the levels seen in the lead up to the financial crisis.

- Entities involved in the facilitation of credit creation (EF4) grew by 5.0% in 2018. The size of these entities, which represent less than 1% of the narrow measure, may be significantly understated due to the difficulty in capturing off-balance sheet exposures. Assets of investment funds involved in credit derivatives have increased in recent years, and accounted for the biggest share of EF4 assets in 2018.
- The nominal value of entities engaged in securitisation-based credit intermediation (EF5), such as securitisation vehicles, remained largely unchanged in 2018, representing 9.3% of the narrow measure. Assets of structured finance vehicles, which include collateralised loan obligations, grew by 9.7%, continuing the growth seen in 2017. However, this growth was offset by a decrease in the assets of Chinese trust companies, which fell by 21.7%.
Section 5 features case studies that discuss different aspects of NBFI in greater detail, including: (i) flow and valuation effects in the investment fund sector; (ii) the role of non-bank financial institutions in providing financing to commercial real estate; and (iii) the role of investment funds in cross-border capital flows.
Datasets from the report are publicly available for use in accordance with to the FSB’s normal terms and conditions.